Fibonacci and the golden ratio
Financial markets are driven by people and are therefore influenced by the behaviour of people. Human behaviour is controlled, in turn, by both conscious and subconscious thought patterns. Whilst we are consciously unaware of its influence over us, the golden ratio of 0.618 appears to govern our judgement in situations where there is an absence of deliberate and/or rational control. This phenomenon is supported by many scientific studies that have endeavoured to define qualities that are subject to human judgement such as, ‘What defines beauty?’. This particular study revealed a strong link between the golden ratio and facial measurements where people judged a face to be more attractive if its features were interrelated by a ratio of 0.618.
Examples
The distance from the chin to the mouth x 0.618
= The distance from the tip of the nose to the mouth
The distance from the centre of the eyes to the chin x 0.618
= The distance from the eyes to top of the head
The discovery of the golden ratio is not new with it being inadvertently chanced upon by Fibonacci, a mathematician from the Twelfth century. Fibonacci was set the task of mapping the population growth of rabbits. He came up with a sequence of numbers that described the generational growth of rabbits, beginning with the initial breeding of just a single pair. Furthermore, he developed a formula for extending this sequence at infinitum. Each number in the sequence is the sum of the 2 previous numbers in the sequence where the sequence begins with the first pair. Hence the start of the Fibonacci sequence is:
1, 1, 2, 3, 5, 8, 13, 21, …
The golden ratio is approximated by dividing any number in the sequence by the number immediately after it. The larger the numbers being used, the closer we come to 0.618.
13 ÷ 21 = 0.6190 | 21 ÷ 34 = 0.6176 | 34 ÷ 55 = 0.6182 | and so on.
The golden ratio can also be expressed inversely as 1.618 and is approximated by dividing each number in the Fibonacci sequence by the number immediately preceding it.
21 ÷ 13 = 1.6154 | 34 ÷ 21 = 1.6190 | 55 ÷ 34 = 1.6176 | and so on.
For the purposes of practical application the golden ratio, and multiples of it, are also expressed as percentages. Chartists may have reason to employ the basic golden ratio in any of the following forms.
1.618, 0.618, 0.382, 2.618 or 38.2%, 61.8%, 161.8%, etc.
The golden ratio, also referred to as the golden proportion , often defines the retracement level of price activity in either upward or downward trending markets. The following chart illustrates this point where the activity of the All Ordinaries Index retraces approximately 38.2% of the previous uptrend.
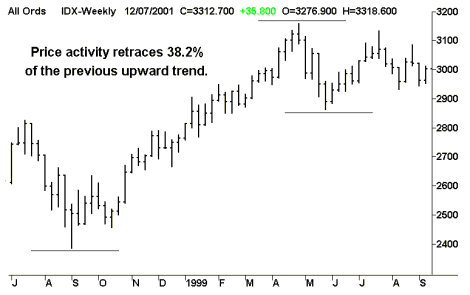
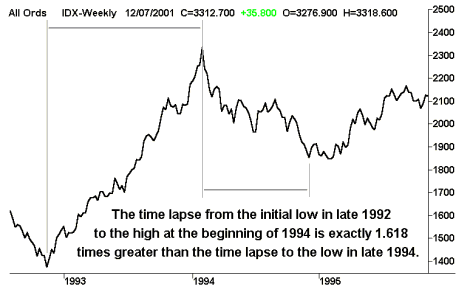
This behaviour gives Chartists the ability to anticipate forthcoming price reversals. Additionally, the golden ratio can also be applied to the time scale of a chart as shown below.
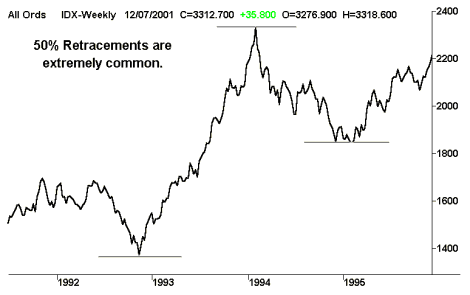
However, these methods of charting can be dangerous for the newcomer who can be easily tempted into ‘Predicting the Market’ rather than ‘Working with the balance of probability’ in their favour. Successful traders predominantly live by the latter philosophy and use the golden ratio to anticipate the market rather than predict it. It should also be noted that human beings have a propensity for symmetry and 50% retracements in price activity are just as common if not more common than those based on the golden ratio. The following chart is a classic example of a 50% price retracement.
This document is copyright. Reproduced with permission by Alan Hull. Inquiries should be made to Alan Hull on phone +61-03-9778-7061 or via e-mail at enquiries@alanhull.com. This article needs to be viewed as educational reference only. It is not intended, nor is it to be regarded, as investment/securities advice or any other advice.