Head and Shoulders Pattern
Overview
A basic principle of technical analysis is that security prices move in trends. We also know that trends do not last forever. They eventually change direction and when they do, they rarely do so on a dime. Instead, prices typically decelerate, pause, and then reverse. These phases occur as investors form new expectations and by doing so, shift the security’s supply/demand lines.
The changing of expectations often causes price patterns to emerge. Although no two markets are identical, their price patterns are often very similar. Predictable price behavior often follows these price patterns.
Chart patterns can last from a few days to many months or even years. Generally speaking, the longer a pattern takes to form, the more dramatic the ensuing price move.
Head-and-Shoulders
The Head-and-Shoulders price pattern is the most reliable and well-known chart pattern. It gets its name from the resemblance of a head with two shoulders on either side. The reason this reversal pattern is so common is due to the manner in which trends typically reverse.
A up-trend is formed as prices make higher-highs and higher-lows in a stair-step fashion. The trend is broken when this upward climb ends. As you can see in the following illustration, the “left shoulder” and the “head” are the last two higher-highs.
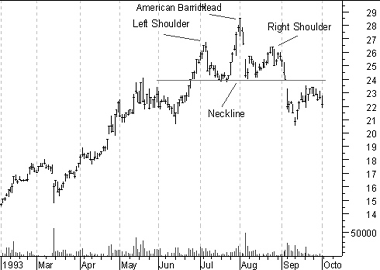
The right shoulder is created as the bulls try to push prices higher, but are unable to do so. This signifies the end of the up-trend. Confirmation of a new down-trend occurs when the “neckline” is penetrated.
During a healthy up-trend, volume should increase during each rally. A sign that the trend is weakening occurs when the volume accompanying rallies is less than the volume accompanying the preceding rally. In a typical Head-and-Shoulders pattern, volume decreases on the head and is especially light on the right shoulder.
Following the penetration of the neckline, it is very common for prices to return to the neckline in a last effort to continue the up-trend (as shown in the preceding chart). If prices are then unable to rise above the neckline, they usually decline rapidly on increased volume.
An inverse (or upside-down) Head-and-Shoulders pattern often coincides with market bottoms. As with a normal Head-and-Shoulders pattern, volume usually decreases as the pattern is formed and then increases as prices rise above the neckline.