Rounding Tops and Bottoms
Overview
A basic principle of technical analysis is that security prices move in trends. We also know that trends do not last forever. They eventually change direction and when they do, they rarely do so on a dime. Instead, prices typically decelerate, pause, and then reverse. These phases occur as investors form new expectations and by doing so, shift the security’s supply/demand lines.
The changing of expectations often causes price patterns to emerge. Although no two markets are identical, their price patterns are often very similar. Predictable price behaviour often follows these price patterns.
Chart patterns can last from a few days to many months or even years. Generally speaking, the longer a pattern takes to form, the more dramatic the ensuing price move.
Rounding Tops
Rounding tops occur as expectations gradually shift from bullish to bearish. The gradual, yet steady shift forms a rounded top. Rounding bottoms occur as expectations gradually shift from bearish to bullish.
Volume during both rounding tops and rounding bottoms often mirrors the bowl-like shape of prices during a rounding bottom. Volume, which was high during the previous trend, decreases as expectations shift and traders become indecisive. Volume then increases as the new trend is established.
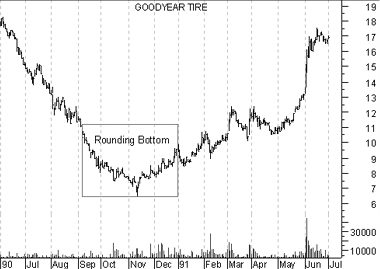
The following chart shows Goodyear and a classic rounding bottom formation.