The Hierarchy Layouts of the D3.js Visualisation Library
In this article I’ll introduce the various hierarchy layouts available in the D3.js visualisation library. I am making the assumption that you (the reader) are aware of the D3.js visualisation library and how it integrates with Stator Visual Studies functionality.
What is a hierarchy layout?
A hierarchy layout is an abstract layout which is generated from data with a clearly defined parent-child relationship. The base hierarchy layout in D3 allows the library to share common code between different graphic layouts and all descendants. These descendant layouts are discussed further in this topic.
But what do I mean by “common code”?
A hierarchy layout is bound to a data object. Certain properties are common to all hierarchy layouts which is why the base layout provides configuration options. For example, the base hierarchy layout best answers the following questions:
- Which property in the bound data object represents the children?
- Which property in the bound data object represents the value we wish to display?
- How should we order the data?
The answers to these questions are common to all the layouts discussed in this tutorial.
At the time of writing the available hierarchical layouts are:
- Cluster Layout
- Pack Layout
- Partition Layout
- Tree Layout
- Treemap Layout
These are discussed in the topics below.
Cluster Layout
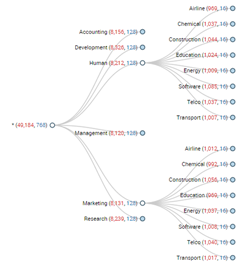
A cluster layout is a diagram representing some kind of cluster. Dendrograms are produced by this layout which places all the leaf nodes at the same depth, that is, all the final children (the leaves of the data tree parent-child relationships) at the same level. Clustering at higher levels in the hierarchy are displayed at varying distances according to dissimilarity.
Pack Layout
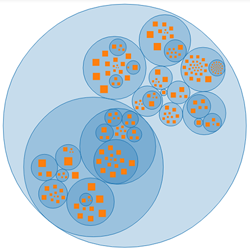
A pack layout is an enclosure diagram which uses containment to represent the hierarchy. An added feature of this layout is that leaf node size can be linked to a quantitative dimension of the data point. Each grouping is enclosed in a circle however due to wasted space only the leaf node size can be accurately compared. This type of layout doesn’t make the best use of available space and therefore undermines its efficacy. A pack layout is still an engaging and entertaining layout and is still used for many applications.
Partition Layout
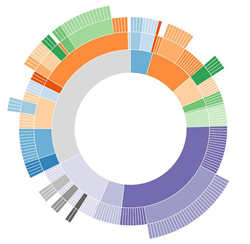
The partition layout produces an adjacency diagram. The size of each node can be used to represent a quantitative dimension of the data which would not be visible with any of the node-link layouts. Nodes are drawn as solid colours and placed adjacent to their parent node, there are no links drawn between parent and child.
Tree Layout
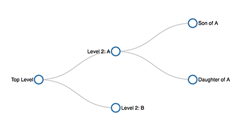
A tree layout creates a node-link diagram. That is, each node is linked via a link between parent and child. The layout itself is generated using the venerable Reingold-Tilford tree algorithm. The algorithm ensures for an efficient, tidy arrangement of nodes at all levels/depths. The tree layout supports both a tree- left to right structure or a radial implementation which can be seen in the image above.
Treemap Layout
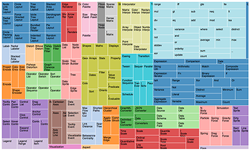
A treemap is a visualisation that recursively subdivides area into rectangles of proportionate size. The treemap was originally developed in the early 1990’s by Ben Shneiderman to visualise the contents of hard drive directories, keeping in mind hard drives were approx. 80MB in size this was a useful visualisation! Today, the treemap is used extensively for its ability to represent proportionality in a finite space.
For a full discussion regarding the history of treemaps click the following link:
http://www.cs.umd.edu/hcil/treemap-history/
Conclusion
D3 is a powerful visualisation library. Hierarchical layouts are useful when visualising data exhibiting parent-child relationships to any level of depth. How you choose to visualise the data is a personal choice however with D3, the choice of different layouts allows you to ensure a visualisation can be generated which gives you the greatest impact and clarity on the story being displayed.
For a more detailed discussion regarding D3.js please click here.