Designing and testing mechanical trading systems
WITH THE ADVENT OF MICROCOMPUTERS A DECADE AGO, the window of opportunity opened for individual futures traders to design and test technical trading systems. Initially, only those traders who were also proficient programmers could do so, since the early trading software was neither very elegant nor user-friendly. At first, two basic approaches were available to traders: “tool box” and “black box.”
Early Approaches Lack Testing Capability
The tool-box approach was limited to charting prices and calculating individual technical indicators. The main drawback was that traders still had to analyze subjectively all of the information to decide what action to take. Since this approach did not generate actual trading signals, it cannot be considered a trading system.
By comparison, the black box approach did generate signals. However, they were based on secret indicators that had fixed, preset values. There was no way to verify whether a system’s logic was even based on sound technical analysis principles. Therefore, all traders using a particular black box system, regardless of their differences in risk propensity, trading style, and financial goals, received the identical signal at the same time and were expected to act on it on blind faith.
Neither approach had a history tester. Traders could not design and test their own trading models on real price data to find the best model to use for each market.
Introduction to Historical Modeling
ProfitTaker, which I developed, was the first full-blown futures trading system with disclosed trading rules. It enabled traders to design and test customized trading models using actual contracts with rollovers under simulated real-time trading conditions. With its innovative modeling concept, ProfitTaker ushered in a new generation of software.
But historical modeling did not become practical until the replacement of the Apple computer (with its limited memory and disk capacity) by the much more powerful IBM and low-cost compatibles as the computer of choice among traders. Before long, a plethora of trading systems followed suit, adopting ProfitTaker’s modeling concept. Then, as satellite technology became more cost effective and daily prices more volatile, traders turned increasingly to day-trading. Now, even traders with limited trading capital can analyze realtime tick-by-tick prices on their computers. Quotation services, which previously provided only price quotes and news information, now offer built-in technical analysis and system modeling software.
Costly Mistakes Must Be Avoided
Today’s traders easily develop and test customized trading models, which can be retested and adjusted as market conditions change. All that traders have to do is pick the price data to be tested and specify the indicator values to use. Depending on the number of models involved and the computer’s speed, this procedure may need to be performed in a two-step process: coarse testing followed by fine testing. First the increment size between values is set relatively large for each indicator. Once a narrow range of profitable models is found, the increment size is reduced. These models are then tested within this more limited range, until the best model is isolated.
This process, by which traders design trading models, test their profitability and search for the best model to use, is widely known as “historical optimization.” Too often, however, after models founded on historical data are applied to current prices in real-time trading, the expected profits are not realized. With so many traders now using computers to design and test trading systems, it is important to examine the intricacies of the modeling process itself and to identify commonly made mistakes that could be costly to your bottom line.
Full Disclosure
First, you should avoid using trading systems that intentionally keep some or all of their trading rules secret. These unwarranted restrictions prevent you from understanding the rationale behind the signals and undermine the discipline and confidence needed for implementing a sound trading strategy.
Testing Is the Means to the End
Another mistake occurs if you become so involved looking for profitable models on historical data that you completely lose sight of the forest for the sake of the trees. Testing is only a means to an end, not an end in itself. You should not try to find the most profitable trading model on historical prices. Otherwise, you risk selecting an isolated model that is surrounded on both sides by poorly performing ones. I call this type of model a “profit island.”
The goal of historical modeling is to find models that have a high likelihood of producing profits and remaining stable in the ensuing period when you are actually trading in real time. To do this, you should look for a broad band of profitable models with the best performing one located near the middle. To either side of the best model are other profitable models, with their performance dropping off gradually the further they are from the best one. A model chosen from this profit cluster is more likely to remain stable even with subsequent changes in price characteristics.
Keep It Simple
As you make an arithmetic increase in either the number of indicators in a system or the range over which each of the indicators can vary, the number of models to be tested increases geometrically. Table 24-1 illustrates the effect that the number of indicators has on the number of models to be tested.
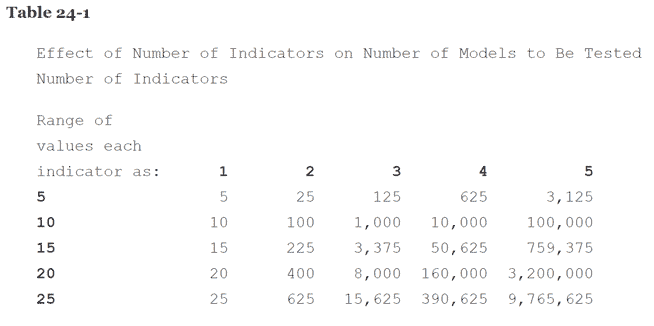
The amount of time it takes to test a system varies in direct proportion to the number of models tested. Therefore, it would be impractical on a microcomputer to test a system on even one market using more than four or five indicators. The coarse testing and fine testing method would be required, and even then the increment sizes might need to be so large that only a small percentage of possible models could actually be tested. Under these circumstances, there is a tendency, after you pick a model to use in real time, to feel compelled to change to other models or to switch indicators each time you incur a string of back-to-back losing trades. This syndrome, known as paralysis of analysis, can become immobilizing.You can see that a system with three indicators, each of which can have a range of 25 values, results in a universe of over 15,000 models. When a fourth indicator is added, the number of models increases to nearly 400,000. Adding a fifth indicator raises the number of models to nearly 10 million. Increasing the range of values over which the indicators vary also causes the number of models to increase, but less dramatically. For instance, a system with five indicators, which can each have 20 values, creates a total of over three million models. Keeping the number of indicators constant at five, but increasing their range of values from 20 to 25, increases the number of models to nearly 10 million.
Still, many traders believe that the more indicators a model comprises, the better the system’s profitability. This may be true up to a point, but then diminishing returns set in. If you use a limited number of indicators in the modeling process, you will discern a general pattern to a market that objectively exists. By contrast, when you employ too many indicators, you merely superimpose a pattern, which actually does not exist, onto the historical data. This is particularly true of indicators that are highly correlated with one another. Then you risk using seemingly profitable models in real time trading. They look good on paper, but conform so closely to the historical data that they have little, if any, predictiveness. This serious pitfall is commonly known as “curve-fitting.” Such models tend to be unstable, decay rapidly, and will therefore subject you to unnecessary losses.
Some software programs now give traders considerable flexibility to write their own trading rules. While this much flexibility may be useful to certain traders who have the time and resources to engage in extensive trading system design, most traders find this much flexibility to be a hindrance to their success as traders. Such software encourages traders to build complex systems with numerous indicators, in the search for the “Holy Grail.” By doing so, traders risk picking “curve-fitted” models, or becoming immobilized by the paralysis-of-analysis syndrome. Most off-the-shelf systems already offer more than enough user flexibility. Unless you have considerable spare time to spend, or are a full-time professional technical analyst, it really isn’t cost-effective to recreate the wheel by designing your own system from scratch. You’re better off leaving that to professional trading system developers.
Know When to Reoptimize
Each market should be reoptimized routinely, on a preemptive basis. Many software programs can screen models to find those that meet your financial performance objectives, saving this information on a disk file. Then you can view the information on your monitor. With fast computers, such as those based on the 80286 or 80386 microprocessor, testing can be done on a rotational basis, one market each night, and several on a weekend. This way, even with a large diversified portfolio, you can easily reoptimize every market that you trade at least once a month.
To make this process virtually a turn-key operation for my clients, I provide a monthly report to them, called ProfitTuner, which tests eighteen actively traded markets on a mainframe computer. In some the models may change from one month to the next, while in other markets the models are quite stable. Since the object is to find models that are not curve-fitted, ProfitTuner lists the 50 best-performing models for each market, rather than the one model that produces the maximum profit.
Whenever a fundamental event takes place, affecting specific markets in a way that could not have been anticipated by the modeling process, you should retest. For instance, a weekend meeting of the G-7 trading partners, with an unexpected announcement of a revised trading range for the U.S. dollar, should immediately raise a red flag for you to perform retesting on those markets.
Check Your Models for Curve-Fitting
Perform blind-simulation testing to see whether your models are curve-fitted. To do this, test your models on a defined time period of historical prices, which I call a testing window. The best model selected is then applied to a trading window composed of entirely different historical prices that were not included in the original test. In this way, real-time trading conditions are simulated, with the performance of the model assessed for its stability, predictiveness, and profitability prior to actually risking capital.
Blind-simulation testing should actually be performed as part of your routine testing. Different size testing and trading windows for each market could be explored, since the window sizes affect the test results and choice of models. Finding the optimal window sizes for each market could substantially improve real-time trading performance.
Make Realistic Assumptions
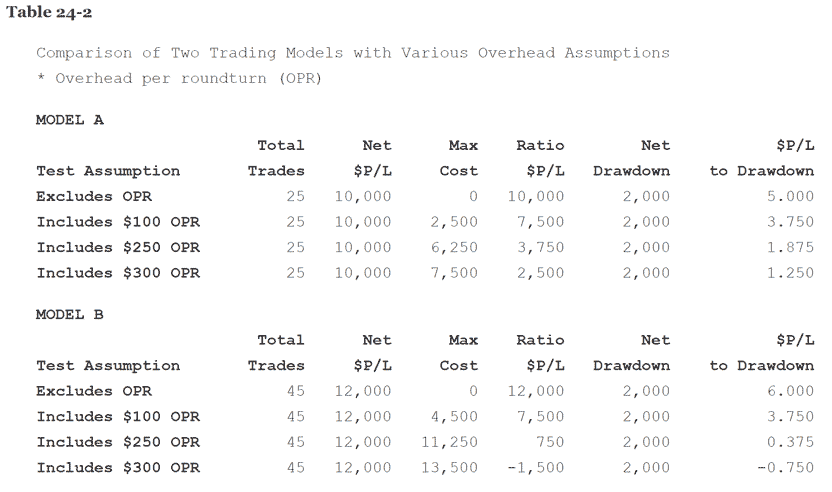
You should also set realistic assumptions about overhead costs, particularly the amount of slippage. If your chosen model isn’t derived under realistic conditions, its performance in real time may be both disappointing and costly. Table 24-2 illustrates the effects that various overhead costs have on a model’s performance.
As you can see in this example, Model A has $10,000 total profit, 25 trades, and $2,000 maximum drawdown. Model B has $12,000 profit, 45 trades, and also $2,000 drawdown. At first glance, when overhead is excluded, Model B appears to be superior to Model A. The risk/ reward ratio of profit to drawdown is higher for Model B.
Then, when a $100 overhead for slippage and commissions is included, both models produce identical net profit and risk/reward ratio. The inclusion of $100 overhead costs is more damaging to Model B because of its higher frequency of trading. This pattern is further exacerbated as overhead costs are increased. At $250 per round turn, Model B’s ratio of profit to drawdown is less than 1.00. At $300, it has a net loss of $1,500.
In effect, the impact of overhead is magnified on models that generate a substantial number of trades. Models that look good when overhead costs are not taken into consideration may prove to be big losers when realistic costs are factored in. Overhead assumptions regarding slippage should reflect differences in each market’s price volatility.
You also need to set realistic values for the limit move in each market. Otherwise, your modeling results will not be based on realistic execution prices. It is incorrect to record the execution of a trade as occurring at the time that the signal is generated when that market is lock-limit. Limit conditions must be accounted for and executions deferred until feasible. The big move in the silver market in 1979-1980 is a classic case where hypothetical track records of trading systems overstate profits due to unrealistic lock-limit assumptions.
A major improvement in this area could be made if data suppliers were to report each market’s daily limit value and the 90-day T-bill rate on a daily basis along with prices, volume, and open interest. Then modeling software could be programmed to check precisely for normal and expanded daily limits during testing to avoid unrealistic price executions, and compare a system’s daily rate of return to the risk-free return.
Test the Right Contracts
The type of contract tested also affects the results and model selected. You can choose between actual contract months with rollovers, single contracts, or artificially derived continuous contracts. My suggestion is to use actual contracts with rollovers because this minimizes unnecessary distortions. Results are less valid when you test single contracts over periods of low volume and open interest. Distortions also occur when you test continuous contracts that don’t realistically handle the price spread between two contract months, at a time when the model has a position on in the expiring contract.
Test the Right Data
It is better to err on the side of more rather than less data. Statistical validity is increased when the testing window size is larger. It would be unwise to select a model based on just a few trades that occurred in the past couple of months. Such a model would not work very well under different market conditions that you might be faced with in the immediate future. Also, you should know about the model’s distribution of profits. If you discover a highly profitable-looking model, but most of its profits were made over a year ago on one or two good trades and it has lost money since, that’s not a worthy model. One quick way to look at the distribution of profits over the test period is to calculate for each model its ratio of profits in the last half of the test period to total profits over the entire test period. Any model with a ratio of less than 50 percent should be rejected, regardless of how well it does on other performance measures.
Of course, you should also verify the accuracy of your data. If it is not clean, your test results will be distorted. Automatic daily updating using a modem will eliminate typo errors that would otherwise be introduced when prices are updated manually from daily newspapers. The cliché garbage-in, garbage-out must be respected when doing historical testing.
Know Your Own Risk Propensity
Experiment with a trading system before actually trading it in real-time. You should be comfortable with it, both in terms of its operation and the indicators that it employs to generate buy/sell signals. Table 24-3 lists a number of performance measures that you can look at when comparing models to one another.
Check the ratio of cumulative net profit to maximum drawdown. Examine the drawdown. Drawdown should not be calculated as the dollar value of back-to-back losing trades. It’s the maximum equity drop from a high point in equity to the subsequent low point in equity until the high point in equity is breached to the upside.
Table 24-3 Performance Measures to Use When Evaluating a Trading Model
- Total number of closed out trades
- Percentage of winning trades
- Percentage of long winning trades
- Percentage of short winning trades
- Gross cumulative profit or loss
- Net cumulative profit (Gross profit less overhead)
- Maximum drawdown
- Ratio of net cumulative profit to drawdown
- Maximum winning trade
- Maximum losing trade
- Average winning trade
- Average losing trade
- Average profit or loss per trade
- Number of consecutive losing trades
- Unrealized profit or loss in open position
- Distribution of profits over time
This ratio gives you a good indication of your risk/reward payoff. Essentially, it tells you the number of dollars you can expect to win for every dollar you put at risk. You should know your own risk propensity. Some traders are willing to risk a dollar to make a dollar. Others need more payoff for each dollar put at risk. Ask yourself how many dollars you would need to make on a given trade to motivate you to risk a dollar by taking that trade. That’s the minimum ratio of profit to drawdown that you should accept.
Make sure that the system’s characteristics and performance are compatible with your temperament, style of trading, and the depth of your pockets. If you can’t handle emotionally or financially the frequency of back-to-back losing trades or the short term drawdowns that a particular system incurs, what good is it if it’s a big money maker in the long run?
Other Modeling Ideas to Explore
Instead of developing models based on recent price data, you might want to test data from previous time periods that closely resemble today’s market conditions. For instance, if you want to find a model that works well during a current drought affecting the soybean market, you might go back and test prior data in which beans were bullish because of earlier drought conditions. The grain markets, in particular, lend themselves to this type of seasonal testing.
Another interesting approach is to incorporate economic or fundamental indicators into your trading strategy. For instance, you might use one or more fundamental indicators to identify a bias for each market as either bullish, bearish, or sideways. Then, for instance, you would only act on your technical system’s buy signals if, at the same time, that market’s fundamental “bias” is bullish. In effect, you are applying a fundamental filter to confirm the technical signal generated by your trading system. This approach can eliminate false signals and alert you to impending turning points in the markets. Recently, I developed a software program called Trader that lets the user do just this by correlating the effects of 50 economic indicators on the price direction in each market.
Conclusion
With system design and testing still more of an art than a science, you are not guaranteed a free lunch from the futures markets. Common sense and businesslike decision making are needed for sound money management and proper portfolio diversification. Costly mistakes in designing and testing trading systems must be avoided. The computer is only a tool. It can help improve your trading if you are already knowledgeable about market dynamics, technical analysis methods, and modelling pitfalls to avoid. But it can’t turn a trader who has not done his homework into an instant winner.
Reproduced with permission Louis Mendelsohn