Is there any order to the markets?
Is there order in the markets?
Are there definable chart formations that form the basic building blocks of price action?
Yes, I believe there are, and I am happy to share them with you. I discovered them many years ago, over time and through the use of statistics. Three basic patterns have emerged that can be seen in any time frame on any chart that is capable of showing you the high and low values of prices. I am interested in the interpretation of these patterns as they apply to price movement. I call this discovery “The Law of Charts,” and it is available to readers of this publication at no charge simply by visiting our website. You can discover the Law of Charts on any kind of chart commonly used in market analysis today: the law can be seen on bar charts, candlestick charts, and point and figure charts.
The Law of Charts
The three basic patterns making up The Law of Charts are as follows:
1-2-3s
Consolidations
Ross hooks
Some of these may be further subdivided as follows:
1-2-3s
1-2-3 highs
1-2-3 lows
ConsolidationsLedgesT
Congestions
Trading ranges
For years traders have looked at price charts and wondered what they meant. Sometimes viewing a price chart is similar to looking at the stars and trying to figure out which ones to connect to show you the formation known as “Taurus, the bull.” All too often chart formations exist only in the eye of the beholder. At what point does a “pennant” formation become a pennant? What exactly constitutes a “coil,” and when is it a coil? Exactly how would you define a “head and shoulders” formation? When can you call a “megaphone” a megaphone? MORE IMPORTANTLY, what do any of these formations tell you?
The discovery of The Law of Charts was quite accidental-something on the order of Newton discovering the Law of Gravity when an apple fell on his head. As with most discoveries, The Law of Charts was discovered through simple observation-studying charts for many years until the formations just popped out and revealed themselves.
The details of the Law of Charts are seen in our E-book entitled, of all things, “The Law of Charts.”
http://www.tradingeducators.com/trading_philosophy/the_law_of_charts.htm
To see how this law is applied in regular trading, we are happy to share with you our weekly journal in which we show actual application of the law. The weekly journal, which we call “Chart ScanT,” is also available at no charge.
The Meaning of the Formations
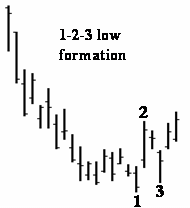
1-2-3s occur only at the end of trends and swings. They are an indication of a change in trend. They take place when the directional momentum of a trend is diminishing. Exactly the way to identify 1-2-3 formations is detailed in our E-book. You will also find in the E-book how to register to receive our Chartscan journal.
Consolidations and the ability to identify them are of utmost importance because prices tend to move sideways far more than they tend to trend.
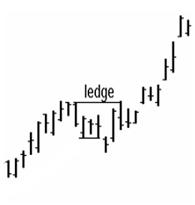
Ledges occur only when values are trending. They constitute a pause in the trend. The pause may be due to profit taking or, more usually, are reflective of uncertainty in the market. The E-book explains more fully how to deal with Ledges. Ledges are consolidation areas consisting of no less than four occurrences of price value and no more than ten occurrences of price value, having two matching highs and two matching lows.
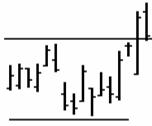
Congestions are sideways consolidations of price value and reflect periods of accumulation and distribution. You might say that they indicate a market that is essentially at fair value with no significant changes in supply or demand. Congestion consists of from eleven to twenty occurrences of price value prior to a breakout.
Trading ranges are extended consolidations of price value. They consist of sideways movement lasting twenty-one bars or more. Interestingly, statistics show that breakouts from trading ranges occur most often on price value occurrences from twenty-one to twenty-nine. Furthermore, the narrower the trading range becomes, the more explosive tends to be the breakout, and the wider the trading range becomes, the less explosive will be any breakout from the sideways action. Trading ranges also reflect markets that are at fair value with little change in supply or demand.
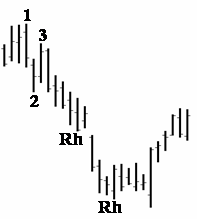
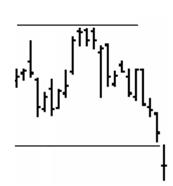
Ross hooks always occur as the result of profit taking. A Ross hook is defined as the first failure of prices to continue in the direction they were previously moving following the breakout of a 1-2-3 formation, the breakout of any of the consolidation patterns mentioned above, or the breakout of a previous Ross hook.
Each one of the basic formations is able to be defined. The specific definitions are available in the previously mentioned E-book, “The Law of Charts.”
Since the basic formations occur in a variety of ways when seen on a chart depicting actual price action, we want to help you fully understand how to apply the law. There is considerably more to the Law of Charts than can possibly be described in this overview article. You can obtain a clear, thorough understanding of how we trade using The Law of Charts through the Chart Scan, which is sent out by E-mail each week.
All of us wish you every success in your trading,
Joe Ross
Reproduced with premission Joe Ross.
If you’re interested in reading more about Joe, you should check out his website at:
www.tradingeducators.com