Internal Rate of Return (IRR)
This tutorial written and reproduced with permission from Peter Ponzo
Once upon a time we talked about XIRR, where have a starting portfolio then, at varying times over the next few years, you invest more or withdraw …
And XIRR will give your annualized return, right?
Yes, and you recall the magic equations that XIRR must solve.
I do?
You start with, say $10K, then withdraw $10K a year later, then another $10K a year later, then invest $10K a year later then, after 4 years, your portfolio is worth $1K. What’s your annualized return, or Compound Annual Growth Rate, or CAGR?
I give up?
You’d have to solve for R, from the equation:
[1] f(R) = 10(1+R)4 – 10(1+R)3 – 10(1+R)2 + 10(1+R) – 1 = 0
where those numbers, namely 10, -10, -10, 10 and -1 are the cash flows … measured in $K.
That last $1K is a cash flow?
Well, let’s assume you cash in your portfolio after 4 years, getting that last $1K and leaving a balance of f(R) = $0.
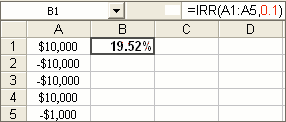
Figure 1
So why are we talking IRR and especially that NPV thing and …?
Patience.
In the above example, the cash flows are uniformly spaced, namely every year. In that case, we can use IRR instead of XIRR, as in Figure 1. Note, too, that we should provide an initial guess, for example 0.1 or 10%.
And if you don’t provide an initial guess?
Then Excel assumes 0.1 or 10%. However, there may be other solutions to Equation [1] that you’d miss if you let Excel do the guessing. Indeed, if we plot the function f(R) we’d get a graph like Figure 2. The solutions are indicated by the red dots.
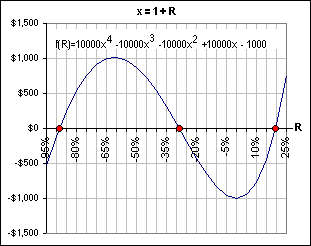
Figure 2
And that 19.52% solution from Figure 1 is the rightmost dot?
You got it.
And that solution between -90% and -80%, in Figure 2?
It’s may not be what you’d regard as a valid solution.
A valid solution?
Yes. When you withdraw money, if the balance isn’t large enough, your portfolio would go negative. You start with $10K and, after a year, withdraw $10K. So you must have a positive return that first year, right? Then, in another year you withdraw another $10K. Your return must be phenomenal … those first 2 years, right?
The following year you add $10K to your portfolio, so the return will be large and negative, reducing your portfolio to $1K, during that last year. We’ve done this before, here. There are plenty of possible returns, year-by-year, which would give you a final portfolio of $0 with the sequence 10, -10, -10, 10 and -1.
For example:
50% the first year (with a balance of $5K after the $10K withdrawal),
then 100% (with a balance of $0K after the next $10K withdrawal)
then X% (any X, since the portfolio is $0)
then -90% (reducing the last $10K investment to $1K).
What about that 19.52%? It bears little resemblance to …
To the four annual returns? Interesting, eh?
So is that 19.52% the only “valid” solution?
I guess it depends upon what you mean by “valid”. Let’s follow the money, assuming we put our money in a bank that pays a fixed 19.52% per year:
after | Balance before | Cash | Balance after
year | cash flow | flow | withdrawal
1 | $11,952 | -$10,000 | $1,952
2 | $ 2,333 | -$10,000 | -$7,667
3 | -$ 9,163 | $10,000 | $ 837
4 | $ 1,000 | -$ 1,000 | $ 0
There’s a negative bank balance! You call that “valid”?
Did I say it was valid? What it means is you borrow money from the bank, at 19.52%. After year 2, for example, you owe them $7,667. In another year you’ll owe them $9,163. That’s when you deposit another $10K, leaving a bank balance of $837. By the end of year 4, that’s worth $1,000 … and that’s yur last withdrawal.
And you call that “valid”?
Call it what you like.
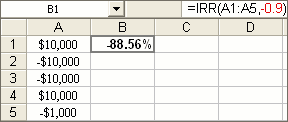
Figure 3
In fact, if you use IRR and use an intial guess of -0.9 you’d get Figure 3.
Aha! That’s the solution between -90% and -80% in Figure 2.
Yes, and following the money in our bank account which pays us interest of -88.56% per year …
You’re kidding, right? A bank that pays -88.56% per year?
You want to call that “invalid”?
Yes!
But suppose your initial $10K was invested in a stock that had a fixed negative return of -88.56% per year? Your portfolio balances would look like this:
after | Balance before | Cash | Balance after
year | cash flow | flow | withdrawal
1 | $1,144 | -$10,000 | -$8,856
2 | -$1,013 | -$10,000 | -$11,013
3 | -$1,260 | $10,000 | $8,740
4 | $1,000 | -$1,000 | $ 0
Notice that the initial $10K got decimated, ending up at $1,144 at the end of the first year. After that first $10K withdrawal you’re left with -$8,856. That means that the broker who holds your portfolio is lending you money … enough to withdraw that $10K.
And he’s charging you … what?
Why -88.56%, of course, which explains why you owe him only -$1,013 after another year.
Uh … where do I find such brokers?
Beats me.
I’d call that invalid!
I’m with you.
Remember:
If the annual returns in 2 successive years are x and y then the return over 2 years is (1+x)(1+y). If we’re looking for a single (real) return R which would generate the same 2-year return, it must satisfy: (1+R)2 = (1+x)(1+y). If (1+x)(1+y) is negative, then such a return R does not exist. How can (1+x)(1+y) be negative? If you invest in naked options, where you can invest $100 yet lose $200.
Moral: Do not expect that an IRR (or even an XIRR) will exist under all circumstances.
So blindly using Excel’s IRR may be misleading, eh?
You got it.
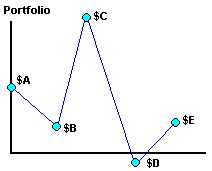
Figure 3A
In fact, if your portfolio evolves as in Figure 3A, you can easily find year-to-year gains which will generate the final portfolio (B/A then C/B then D/C etc.) … but not necessarily a single CAGR which will generate that final portfolio.
Okay, what about that NPV stuff?
Almost forgot, but I should point out one other thing. Figure 2 seems to indicate that there are three solutions to Equation [1], namely -88.56%, -28.58% and +19.52% when, in fact, there are four-count-em-four solutions. That’s because it’s a 4th order polynomial equation and they always have 4 zeroes.
Where is it?
If R is HUGE, then f(R) looks like 10(1+R)4 (since all the other terms would be small in comparison). Then f(R) will be postive when R is HUGE and, indeed, will head off to infinity … like Figure 4.
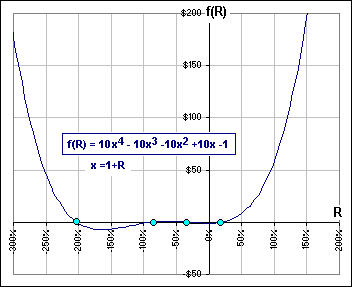
Figure 4
Then we know there’s another negative root … at about -200%.
And you’d get a loan at -200% from your broker, right?
Dreamer.
Net Present Value
Okay, now we take Equation [1] and play with it. It says that, after 4 years, our portolio is worth $1K. Suppose that, instead of $1 kilobucks, our portfolio were worth $P kilobucks. In fact, to make things more sanitary, let’s suppose that all Cash Flows are positive … for the time being.
Then we’d have:
[2a] 10(1+R)4 + 10(1+R)3 + 10(1+R)2 + 10(1+R) = P
Now let’s divide by (1+R)4 to get:
[2b] 10 + 10/(1+R) + 10/(1+R)2 + 10/(1+R)3 = P/(1+R)4
What’s that right side, P/(1+R)4, mean?
I give up.
It’s like, if something will cost $P in 4 years and inflation is R per year, you can buy it now for P/(1+R)4. It’s the value of our P kilobuck portfolio, discounted 4 years by the rate R per year. In other words, if it’s worth P in 4 years, today it’s worth only P/(1+R)4. In other words, if we had P/(1+R)4 today, and invested it at the rate R (where R = 0.12 means 12%), then it’d be worth P in 4 years.
In other words …
Okay! Okay! So what?
So what? You kidding?
Look at the left side of [2b]. It tells us what our portfolio is worth in terms of the Cash Flows 10, -10, -10 and 10 !
So what?
So you then have the Present Value of those four Cash Flows. If you promised somebuddy that she’d receive those 4 Cash Flows, year after year, starting immediately with the first instalment of 10, what’d you charge her?
Uh … well …
She’d get 10 right away.
In a year she’d get another 10 … and that’d be worth 10/(1+R) today.
In another year she’d get another 10 … and that’d be worth 10/(1+R)2 today.
In another year she’d get another 10 … and that’d be worth 10/(1+R)3 today.
Altogether, that sequence of Cash Flows would today be worth …
The left-side of Equation [2b].
Exactly!
Seems like a lot of calulations … if you got dozens of cash Flows.
Excel has a function NPV which goes like this:
NPV = A1/(1+R) + A2/(1+R)2 + A3/(1+R)3 + … + An/(1+R)n
where A1, A2, etc. are the Cash Flows and you’d use it as shown in Figure 5. The numbers called Pres. Val. are the Cash Flows divided by a power of (1+R), namely:
-16000/(1+R) = -14814.81 then
5000/(1+R)2 = 4286.69 etc.
And they add up to that NPV value, right?
Right.
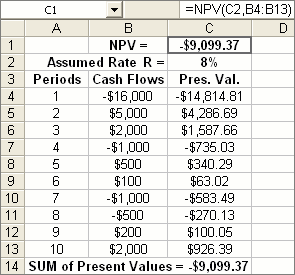
Figure 5
So that IRR and NPV are … uh, intimately related?
Yes. In fact, in Figure 5, we assumed a Rate R = 0.08 (or 8%). However, had we assumed a Rate of R = IRR(B4:B13,-0.1) we’d have got NPV = $0. That’s shown in Figure 6, where the IRR rate (for that particular sequence of Cash Flows) is -17.8% and the resulting NPV is $0.
So IRR is the rate that makes NPV =$0, right?
Yes, indeedy.
In Figure 5, their are negative Cash Flows … including the very first cash Flow.
Yes, I see. Of course, IRR and/or NPV can be used in a variety of situations … including those that have both positive and negative Cash Flows.
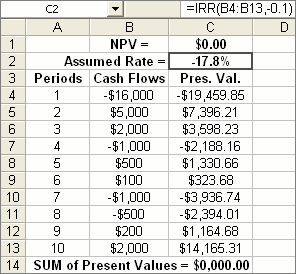
Figure 6
Suppose you buy a small variety store for, say $16K. That’s money paid out … so we consider it negative. You expect income at the end of years 1 and 2 of $5K then $1K. That’s money received … so we consider it positive. The following year we lose $1K. That’s money lost … so we consider it negative. The following year we make $500K so …
Yeah, yeah. I recognize the Cash Flows from Figure 5.
Okay, so with those particular Cash Flows, the NPV is -$9099.37 and that’s means a loss.
I wouldn’t buy that outfit, would you?
No, but future Cash Flows are estimates. If I were selling you my store, I’d make them all positive. Look at Figure 6. It shows profits each year. The IRR is 11.9% so you’d be happy with that annual return, eh?
Based upon just a few years … and assuming the estimates are correct.
Of course, so we …
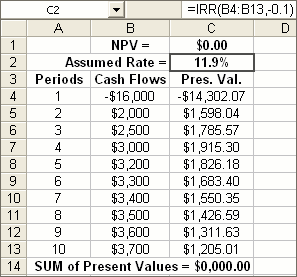
Figure 7
Hold on! Why is NPV = $0.00?
Remember what NPV(C2,B4:B13) is:
NPV = -16000/(1+R) + 2000/(1+R)2 + 2500/(1+R)3 + … + 3700/(1+R)10
It’s saying that the payment of $16,000 occurs after 1 year and you receive the first income of $2,000 at the end of the 2nd year … and so on. Stare intently at this result. It’s saying that if you sell the store for $3700 at the end of year 10, you’d have made 11.9% on your $16K investment. If you sell the store, your “store investment” is now $0 and …
And that’s NPV!
Right!
But what if I sell the store and get the $16K now … not after 1 year?
Then you’d calculate the Present Value like so:
-16000 + 2000/(1+R) + 2500/(1+R)2 + … + 3700/(1+R)9 = -16000 + NPV(R,B5:B13)
Figure 8 shows what it all looks like, assuming a discount rate of R = 0.08, or 8%. If you blindly use NPV without a modicum of cerebral gesticulation, then …
Then you’ll get it wrong?
Sometimes …
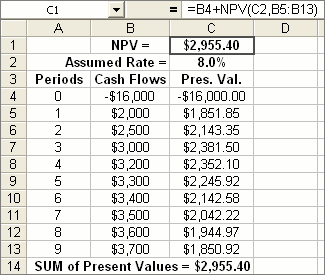
Figure 8