Triangle Pattern
Overview
A basic principle of technical analysis is that security prices move in trends. We also know that trends do not last forever. They eventually change direction and when they do, they rarely do so on a dime. Instead, prices typically decelerate, pause, and then reverse. These phases occur as investors form new expectations and by doing so, shift the security’s supply/demand lines.
The changing of expectations often causes price patterns to emerge. Although no two markets are identical, their price patterns are often very similar. Predictable price behavior often follows these price patterns.
Chart patterns can last from a few days to many months or even years. Generally speaking, the longer a pattern takes to form, the more dramatic the ensuing price move.
Triangle Pattern
A triangle occurs as the range between peaks and troughs narrows. Triangles typically occur as prices encounter a support or resistance level which constricts the prices.
A “symmetrical triangle” occurs when prices are making both lower-highs and higher-lows. An “ascending triangle” occurs when there are higher-lows (as with a symmetrical triangle), but the highs are occurring at the same price level due to resistance. The odds favor an upside breakout from an ascending triangle. A “descending triangle” occurs when there are lower-highs (as with a symmetrical triangle), but the lows are occurring at the same price level due to support. The odds favor a downside breakout from a descending triangle.
Just as pressure increases when water is forced through a narrow opening, the “pressure” of prices increases as the triangle pattern forms. Prices will usually breakout rapidly from a triangle. Breakouts are confirmed when they are accompanied by an increase in volume.
The most reliable breakouts occur somewhere between half and three-quarters of the distance between the beginning and end (apex) of the triangle. There are seldom many clues as to the direction prices will break out of a symmetrical triangle. If prices move all the way through the triangle to the apex, a breakout is unlikely.
The following chart shows Boeing and a descending triangle.
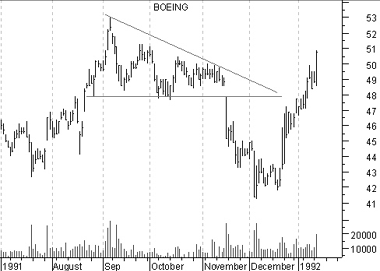
Note the strong downside breakout on increased volume.